- Change theme

CRISPR Screen Analysis: From NGS Data to Discoveries
Why Data Analysis is the Key to CRISPR Screen Success.
07:23 02 September 2025
In the race to uncover the genetic drivers of disease, running a CRISPR screen is only half the battle. The real challenge begins when terabytes of next-generation sequencing (NGS) data arrive, and the task shifts to pinpointing which of thousands of genetic perturbations truly matter.
A well-executed screen can generate a goldmine of biological insight, but without precise, systematic analysis, even the most promising hits can be buried under noise. Poor-quality reads, uneven library representation, or inconsistent replicate performance can all obscure real effects—leading to missed discoveries or false positives. This is why an optimized analytical pipeline—combining robust quality control, advanced statistical modeling, and clear visualization—is as important as the experimental design itself.
If you want to see how a dedicated, end-to-end platform can transform raw CRISPR screen data into clear, actionable genetic insights,click here to explore Ubigene’sCRISPR screen analysisservice. By integrating automated QC, alignment, and enrichment workflows, it minimizes the lag between experiment and discovery—helping researchers move from data to decisions with confidence.
In this article, we’ll break down what makes CRISPR screen analysis effective, the tools and strategies that speed up insight generation, and how optimized analytics can uncover genetic patterns that traditional methods might miss.
How CRISPR Screen Analysis Powers Precision in CRISPR Gene Editing
At its core, CRISPR screen analysis is the bridge between large-scale screening data and precise, targeted CRISPR gene editing outcomes. In a pooled screen, thousands—or even tens of thousands—of single guide RNAs (sgRNAs) are introduced into a cell population, each targeting a specific gene. After applying a selective pressure, such as a drug or stress condition, researchers sequence the surviving cells to determine which sgRNAs have increased or decreased in abundance.
By comparing read counts before and after selection, scientists can identify genes whose disruption or activation drives a measurable change in the phenotype of interest. These “hits” may reveal critical pathways, potential drug targets, or unexpected genetic interactions—each of which can guide more accurate and efficient gene edits.
Unlike generic bioinformatics workflows, CRISPR screen analysis requires specialized tools and statistical models tailored for pooled library data. Factors like library coverage, replicate correlation, and statistical power all need to be accounted for—otherwise, small biases can snowball into misleading results.
When seamlessly integrated with expertCRISPR gene editingworkflows for downstream validation, these analytical insights move quickly from discovery to functional application, reducing delays and improving the success rate of follow-up experiments.
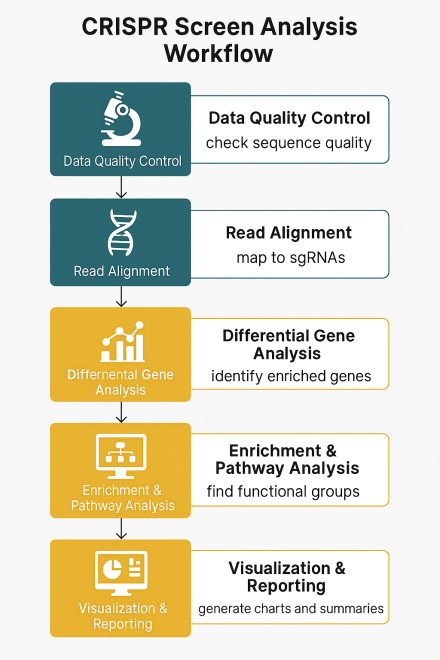
Step-by-Step CRISPR Screen Analysis Workflow

1. Data Quality Control (QC)
- Check read length, adapter contamination, and per-base sequence quality.
- Aim for 200–500 reads per sgRNA to ensure statistical confidence.
2. Read Alignment
- Map reads to the reference sgRNA library using tools like Bowtie or BWA.
- Misaligned reads can skew abundance estimates and hit calls.
3. Differential Gene Analysis
- Identify significantly enriched or depleted genes with tools like MAGeCK or BAGEL.
- Positive selection: guides that become more abundant suggest suppressor genes.
- Negative selection: guides that drop suggest essential genes.
4. Enrichment & Pathway Analysis
- Use GO, KEGG, or Reactome to understand shared functions among hits.
- Example: DNA repair pathway enrichment may signal synthetic lethality targets.
5. Visualization & Reporting
- Use volcano plots, heatmaps, and bubble charts to present findings clearly.
- Highlight top hits with fold change and p-value cutoffs for quick review.
A streamlined pipeline with preset QC thresholds, automated modeling, and built-in visualization can cut analysis time from weeks to days—reducing the risk of misinterpretation while standardizing every stage.
Key Analytical Tools & Methods in CRISPR Screen Analysis
Choosing the right analytical tool can make the difference between vague results and clear, actionable genetic insights. In CRISPR screen analysis, certain platforms have become gold standards for accuracy, reproducibility, and biological relevance.
- MAGeCK & MAGeCK-VISPR– Provides robust normalization, hit calling, and built-in QC metrics for pooled CRISPR screen data. Ideal for genome-wide knockout or activation screens requiring high sensitivity and statistical confidence.
- BAGEL– A Bayesian approach for identifying essential genes, especially effective in negative selection screens such as cancer dependency mapping.
- GSEA (Gene Set Enrichment Analysis)– Detects pathway-level patterns from subtle but coordinated gene changes, helping reveal biological significance beyond single-gene effects.
- Integrated Pipelines– Combine QC, statistical modeling, and visualization into a unified workflow, ensuring consistent results while reducing manual reformatting time.
The chart below compares these leading CRISPR screen analysis tools—highlighting their primary functions, best-use scenarios, and core advantages—so researchers can quickly select the most suitable platform for their project.

Acceleration Strategies for Faster Insights
- Automated QC and Normalization– Pre-set thresholds eliminate manual delays.
- Parallel Analysis– Run statistical and pathway analysis simultaneously.
- Pre-Built Templates– Avoid trial-and-error configuration.
- Direct Validation Link– Move top-ranked candidates immediately into validation assays.
- High-Performance Computing– Process large datasets in hours, not days.
Speed isn’t just about faster processing—it’s about designing workflows that anticipate bottlenecks and integrate seamlessly with wet-lab validation.
Real-World Case Examples

- Oncology– Automated QC cut analysis time from 3 weeks to 6 days, confirming synthetic lethal gene pairs.
- Virology– Parallel pathway analysis revealed 8 host factors for viral replication, all validated without re-running the screen.
- Immunology– Direct data-to-validation workflow reduced project time from 12 weeks to 5.
- Drug Resistance– Cloud-based processing handled all replicates in 24 hours, guiding a drug combination strategy.
Best Practices for High-Impact Analysis
- Define analysis goals before experiments.
- Standardize data input formats and library IDs.
- Pre-set QC thresholds (200–500 reads/sgRNA, replicate correlation >0.9).
- Choose the right statistical model for your screen type.
- Integrate pathway context early.
- Visualize results for clarity, not just decoration.
- Keep analysis and validation teams in sync.
- Document all parameters for reproducibility.
Guardrails Against Common Pitfalls
- Off-Target Noise– Use multiple sgRNAs per gene and validate top hits.
- Low Sequencing Depth– Set minimum coverage before sequencing.
- Statistical Overfitting– Keep models as simple as necessary.
- Batch Effects– Use technical replicates and batch correction algorithms.
- Interpretation Delays– Link analysis output directly to experimental planning.
The Future of CRISPR Screen Analysis
As CRISPR screening matures, analysis is shifting from retrospective to predictive.AI-assisted hit prioritizationuses machine learning to flag high-value gene candidates before validation, reducing experimental load.
Multi-omics integrationlinks CRISPR results with transcriptomic, proteomic, and metabolomic data, revealing mechanisms that single-data-type analysis might miss.
Cloud-based collaboration platforms allow teams to share datasets and visualizations in real time, accelerating decisions and eliminating version control issues.
As these innovations mature,CRISPR screen analysiswill function as a continuous discovery engine—predicting gene networks, integrating with automated wet labs, and deliveringCRISPR gene editingtargets with unprecedented precision.
Conclusion
In today’s competitive research environment, the ability to interpret CRISPR screen data quickly and accurately defines the pace of discovery. An optimized analysis process increases confidence, reduces false leads, and builds a stronger foundation for downstream work.
By embedding analysis into the core of project design, every decision—library design, selection strategy, statistical method—feeds into a reproducible workflow. Whether the goal is identifying disease targets, mapping pathways, or finding synthetic lethal pairs, robust CRISPR screen analysis moves teams from raw data to actionable insights faster, and with greater reliability.